")
More and more of our daily activities take place online: we shop, we converse, we share, and most importantly for advancement professionals, we give. Last year, online gifts represented 7.9% of all gifts made to charitable organizations—which may not seem like a large number, but that’s up from just 4.9% in 2013. And that number will only continue to rise.
If you’re like most annual fund shops, you already do a great job of tracking metrics associated with direct mail and in-person solicitations.
But as online giving trends upward, it’s just as important to build out a framework for taking stock of online participation and trends.
Here are three tiers of metrics you can use to better understand your digital giving footprint—one for beginners, one for intermediates, and one for the shops that are furthest along.
Tier I: Basic Online Gift Totals
As an institution starting from scratch, the three most important items to track are:
- The percentage of gifts that come in online
- Total dollars from online donations
- Total donors who give through your online gift portal (per appeal or overall)
These data points may seem simple, but you’ll be amazed at the insights you can glean from measuring them year over year.
For example, tracking the percentage of gifts that come in online will help you determine how you should be asking your constituents for support.
If the percentage is relatively high (over 30-35 percent), you may want to prioritize email solicitations or invest in personalized or project-specific giving pages. If it is relatively low (less than 10 percent), you may want to beef up your mailed appeals and follow up with donors in ways that align with how they prefer to give.
A low online gift rate is also a good opportunity to assess the quality and ease of use of your giving platform. Donors have come to expect fast and easy online checkout experiences—and giving to our institutions should be no different.
Once you’ve mastered tracking these three metrics, your shop might be ready for Tier II.
Tier II: Online Donor Profiles
The next set of important metrics dives deeper into the metrics listed in Tier I and involves creating profiles of your online donors. The makeup of your online donors can provide a wealth of information for you and your colleagues.
Try looking for a few of the following attributes to get started:
- Class year
- Constituency
- Donor type
- Gift designation
- Gift timing
Understanding who your online donors are can help immensely when it comes time to develop a communications plan and outreach strategy. What age ranges give the most online? Where do they give? How often? What time of the year? Week? Day?
The more you know about your online donors, the easier it’ll be to design a communications calendar and craft targeted messaging for this cohort. Especially with limited time and resources, it might not be worth emailing everyone when you can focus on a smaller group and get the same or better results.
These data points lead directly into Tier III.
Tier III: Advanced Metrics
For shops with the time, technology, and resources, there’s no limit to what you can track, analyze, and test in regards to online giving. Here are just a few ideas:
1. Use A/B testing to help gauge the success of your email messaging and timing.
The better and more targeted the solicitation, the more likely you are to convert your constituents into donors—and testing one story versus another can help you refine the messaging. In addition, testing when you send an email can help cue you into the perfect mail time.
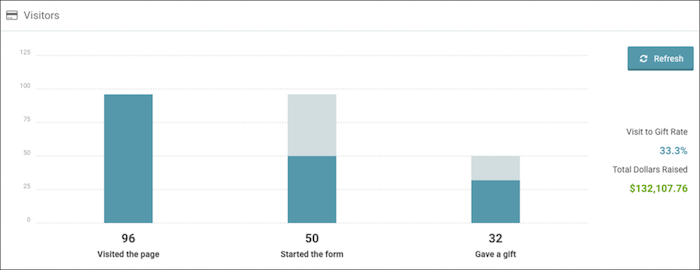
2. Track visit-to-gift or appeal-to-gift rates to understand the effectiveness of your online giving efforts.
Of everyone who visited your giving page, how many people (and who) followed through to make a gift? Who started filling out the form but abandoned before completing it? Tracking these metrics during a campaign can help you prioritize outreach and focus on just the “non-completers” with your next email or phone push.
If you use EverTrue’s online giving platform, you can find these conversion analytics in your giving dashboard. You have the ability to drill down by giving page or view the numbers for all your pages together.
Learn how Williams College uses conversion analytics in EverTrue to re-target non-donors.
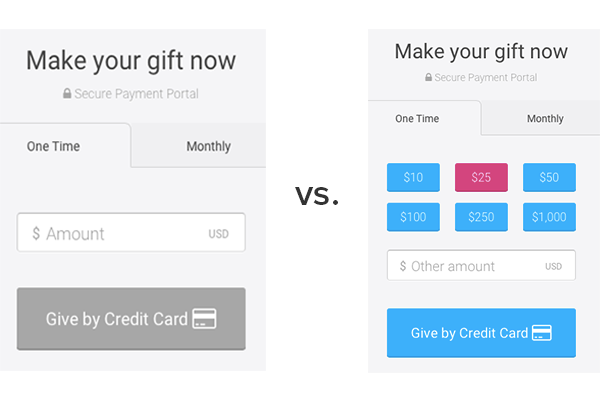
3. Test your ask amounts, copy, and/or imagery on your giving page to see what provides the right hook.
Oftentimes it’s the smallest things that can turn a “no thank you” into a “sign me up.” Taking the time to figure out what will make the difference for your donors is incredibly valuable—whether that’s adjusting the ask amounts or the imagery a donor sees on your giving page. As fundraisers, we tend to only have small window of time to convince our constituents to give. If you have the technology, it’s in your best interest to find out what will make the best impression in that small window.
The list can keep going. You’re only limited by the technology you have and your imagination.
The more you track about your online giving operations, the more strategies you can put into action to convert donors. Good luck!
Looking for a new online giving solution? Learn how EverTrue can help you track online giving metrics and deliver a beautiful giving experience.
Josh Foladare is the senior director of alumni relations and annual giving at St. John Fisher College and formerly the director of annual giving at Hobart and William Smith Colleges. When he is not helping raise money to make the colleges great, you can find him brainstorming new ways to explain what he does at work to his friends and playing with his two rescue dogs. Connect with him on LinkedIn.