











Carrick Davis, vice president of the APRA Wisconsin chapter and prospect development analyst with the Wisconsin Foundation and Alumni Association (WFAA), believes the efficacy of prospect research is not best measured by the number of wealthy prospects it uncovers, but in the efficiencies it introduces to fundraising operations.
With a master’s in urban planning from the University of Michigan, Carrick is used to thinking spatially and exploring how space and place influence behavior. The University of Wisconsin has over 400,000 living alumni, and the Foundation database has nearly double that number in living individual prospects (alumni, parents, and friends). When faced with those daunting numbers—and the need to identify and prioritize high capacity prospects—Carrick drew upon his urban planning experience to help create a scalable approach to prospecting that overlays alumni data, U.S. Census data, and geographic data. Carrick presented this methodology at Prospect Development 2014, APRA’s 27th Annual International Conference, and presented a streamlined approach at APRA Wisconsin’s 2014 Fall Conference. Recently, I talked to him about the development and evolution of this prospecting tool.
What led you to use geographic data in developing your model?
At the Foundation, and indeed at most fundraising shops, individual wealth screening is the gold standard to estimate individual capacity. But the sheer numbers of unscreened prospects we have in our database present all kinds of challenges in terms of time and resources. It costs time and money to properly implement and validate screening results, and with so many alumni, parents, and friends, we ended up with large pockets of prospects with very little or surprisingly low capacity data. There are always some people whose wealth is so well-hidden that even a screening doesn’t find it, so the question became, could we come up with a creative and innovative way to estimate capacity in greater volume? Our goal was to reduce the time, expense, and uncertainty of estimating philanthropic capacity and to supplement the information we already have in our database about any given prospect’s suspected wealth and income. With my background and my interest in data-driven solutions, I began to look at ways a geographic approach might present an answer.
UW alumni near Naperville, IL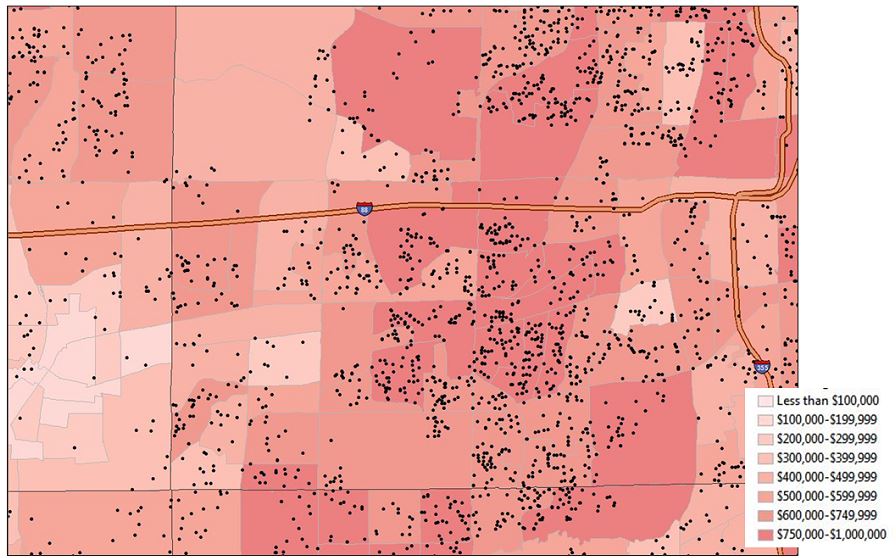
Can you briefly describe the tool that was developed?
Sure. Our core assumption is that similar people clump together geographically. We see this in politics when we talk about red states and blue states. As a Detroiter at heart, I think of how that community shifts at 8 Mile, where it changes from one of the nation’s poorest geographic areas to one of the wealthiest. In other words, wealth can be a place-based attribute. The average wealth in a particular area provides an educated guess about the wealth of the individuals who live within that area.
The American Community Survey is an arm of the U.S. Census Bureau that collects information about income and home value (and myriad other data) in a systematic fashion. That data is free and public, and released on American Fact Finder; however, the Census does statistical aerobics to de-identify and anonymize the data it releases. Our pilot project focused on our Chicagoland prospects, but our ultimate goal was to develop a scalable tool which would reduce the heavy lifting of large downloads and organizing millions of rows of data. To this end, the Foundation made the decision to purchase a Census data append.
The data we purchased gave us data at the ZIP+4 level. That’s about 7-14 households, a very small, granular, geographic area. The cool thing is that because nearly every record in our database has a zip code, we immediately have nearly full coverage in our database. It is very easy to join this Census data to an individual record and know the median home value or median income for the very small geographic neighborhood around a prospect. With this survey data, we can use neighborhood-level information and build a simplistic data model to predict wealth of an individual.
Our analytics team built a regression model. The dependent variable was being an A-rated prospect. At the Foundation, an A-rated prospect is one with the capacity to give $1M over five years. I should further clarify that our capacity calculator includes an element of historical giving and is not solely asset based. So our model would have components of both capacity and previous philanthropic activity.
With this model, a score was produced for each individual. Now when we are prospecting, we can sort thousands of people by their “wealth” scores whether or not we have individual capacity information. All other things equal, we can look for the next best prospects for our development directors to reach out to based on the estimated wealth of their immediate geographic area.
UW alumni on the Chicagoland map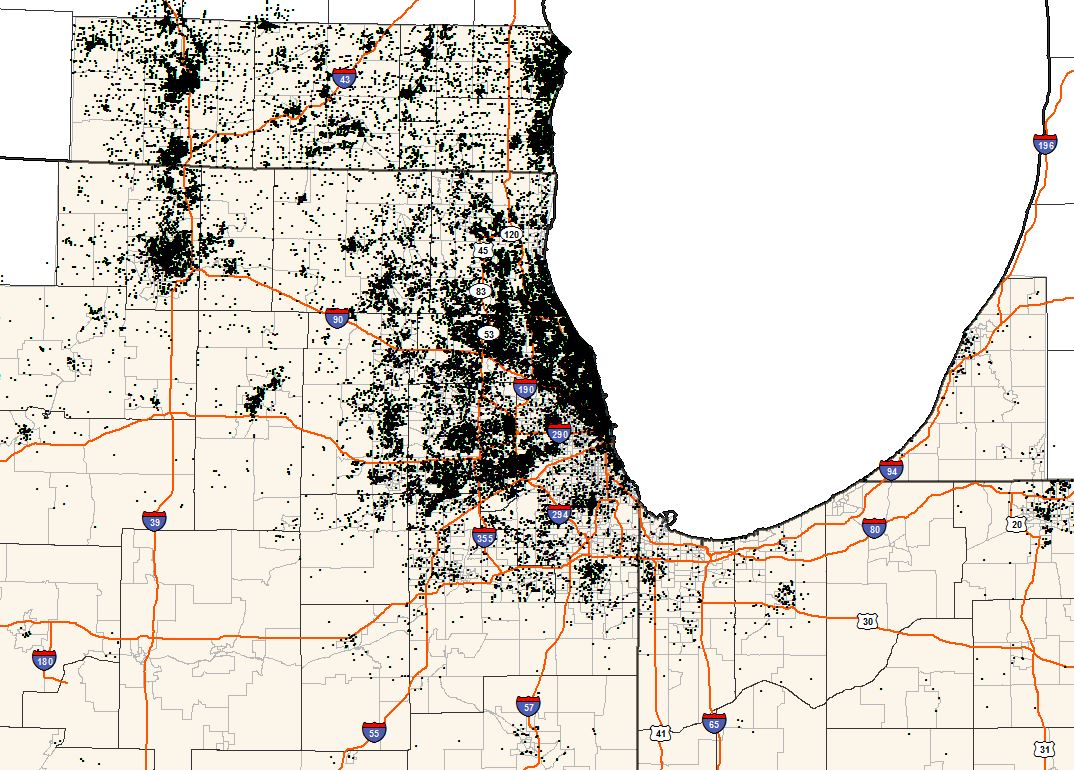
Where did you locate these scores? Are they, for example, an additional prospect research rating in your database?
No, we actually keep them in our data warehouse. We don’t want to mix these estimates with data that has been painstakingly researched and verified. These models only produce estimates and scores, and at this point we’re still piloting the approach. We use the warehouse as a sandbox to workshop and explore different prospecting methods, so development doesn’t see a lot of these efforts. We only share the results.
You mentioned that the Foundation ended up purchasing the census data “to reduce the heavy lifting.” Are there other advantages to using the purchased data?
Purchasing the Census data gave us a nation’s worth of data in one fell swoop. Besides simplifying the task, it meant we got national coverage. By implementing our model nationwide, we weren’t limited by only looking at the locations of the alums we already knew, and we could identify new, previously unexplored, geographic regions with great potential for our development directors. It also means that if an alum moves, it is very easy to re-score them.
Can you share any victories you’ve achieved with this new approach?
For me, the biggest win has been trying to get the Foundation to think more analytically and to use data to drive processes and decisions. I’d be hard pressed to define the success of the Research & Prospect Management team by the number of prospects we identify or one big gift that comes from the result of our research. But we have gotten development directors who are used to going with their gut to be more confident in using data. To me, the goal of prospect research is to guide development officers to better prospects and to minimize the need to dis-qualify “bad” prospects.
And, speaking more personally, working with the team to develop the model and beginning to implement the scores was exhilarating. It brought together my background in urban planning and data analysis to meet a concrete business need.
Thanks, Carrick!
If you have more questions on how the team at WFAA developed and implemented this tool, you can contact Carrick directly via email.
Sarah Bernstein is an independent consultant in Milwaukee, WI, supporting nonprofit organizations with prospect research and database analysis. She earlier worked in both the social service and higher education sectors. Sarah is an active member of APRA International and past president of the APRA Wisconsin Chapter. She blogs at The Fundraising Back-Office and can also be found on LinkedIn and Twitter.