Note: This report was updated in early 2025 to reflect updated numbers from final recording of December gifts.
In our 2024 Giving Report, we take a look at donor and fundraising revenue data from 2024 to identify key trends, highlight major gift activity, and evaluate overall fundraising performance. This report includes information from a robust dataset, encompassing 110 higher education institutions, 19.2 million gifts, and more than 6.95 million donors. By analyzing this broad sample, we provide a clear and comprehensive picture of the year.
Key areas of focus include year-to-date donor counts, major gift donor activity, and the remarkable growth in revenue from high-level contributions. While many institutions experienced strong gains this year, particularly in major gift fundraising, questions remain about the sustainability of these outcomes in future years.
As always, our data reports aim to provide actionable research and a deeper understanding of the trends shaping the higher education philanthropic landscape.
Major Gift Growth is Driving Fundraising Success Revenue from major gifts ($50,000+) increased by an average of 65% across the sample institutions in 2024. However, this growth was not evenly distributed. Some institutions benefited from one-time transformational gifts, while others saw incremental growth driven by consistent donor engagement.
Remarkable Performance from $1 Million+ Donors High-level major donors contributed significantly in 2024, with revenue from $1 million+ gifts surpassing 2023 totals. This segment continues to play an outsized role in fundraising outcomes, underscoring its importance in institutional strategy.
Donor Count Decline Continues Despite strong major gift revenue, donor count in 2024 has declined, continuing a multi-year trend. With year-to-date donor totals trailing 2023 by over 250,000 donors, institutions face ongoing challenges in retaining and expanding their donor bases.
December’s Role December has historically been a crucial month for donor participation, but its relative impact has steadily declined over the past decade. December 2024 saw the lowest percentage of calendar-year donors in at least 10 years, and likely the lowest in history.
The Sustainability Question With extraordinary gains in major gift productivity, institutions must ask whether their pipelines can sustain this level of performance. Strategic focus on pipeline health and cultivating future major donors will be critical to maintaining momentum.
Donor Trends in 2024: A Challenging Year For Donor Participation
The first chart below underscores this challenge, with donor numbers for 2024 trailing previous years. Despite year-end giving efforts, total donor participation in 2024 declined by 7.2% compared to 2023. The drop in donor count highlights ongoing retention and acquisition challenges that many institutions face.
Click graphs to enlarge
Interestingly, these trends are not being driven by a few outliers, but rather they reflect a broad pattern across the industry. The second chart below compares January through October donor counts for 2023 and 2024, and illustrates the varied performance among programs. By excluding November and December from this analysis, we’ve accounted for gift entry lags that could otherwise skew results.
Donor decline was widespread. 7 out of 10 institutions saw a decrease in total donors. While some programs were able to sustain or grow their donor bases, nearly half of all institutions experienced a decline that exceeded the 7.2% average loss.
Institutions must take a more proactive approach to donor retention reacquisition, identifying engaged mid-range and lower donors, and reactivating lapsed supporters.
A Turning Point in 2024’s Donor Trend
The donor deficit for 2024 began to take shape in July, following a relatively strong start to the year. As the chart shows, donor counts from January through June were on par with 2023 levels. However, starting in July, most months experienced a decline in donor activity compared to the previous year.
The back half of 2024 was particularly challenging, with donor counts trailing 2023 in every month after April.
This shift coincides with two major events: the start of the new fiscal year for many institutions and the ramp-up in political fundraising efforts ahead of the November presidential election. While these factors align with the timing of the decline, establishing a direct causal link remains challenging.
With political giving reaching record levels, institutions must consider how external competition for donor dollars affects annual fundraising strategies. Shifting outreach efforts earlier in the year and diversifying donor engagement tactics can help mitigate these challenges in future cycles.
Understanding how external pressures such as fiscal year transitions and competitive donor environments influence donor behavior is important as institutions plan for future fundraising strategies.
Breaking Down 2024’s Monthly Donor Deficits
The monthly donor deficits for 2024 are detailed in the two charts below. While 2024 outperformed 2023 in January and April, donor counts have trailed behind in nine of the past eleven months. The November shortfall is particularly significant, though it may decrease slightly as institutions process delayed Giving Tuesday gifts. However, the current size of the deficit makes it unlikely that 2024 will surpass 2023 in overall donor counts.
The bar chart below further illustrates the extent of the decline, with the largest deficits appearing in the fall months, most notably October and November. This pattern reflects the sustained downward trend in monthly donor activity that began after July.
These data points serve as a reminder of the importance of executing well-planned donor retention and reacquisition strategies, and improving operational efficiencies to minimize delays in reporting and gift entry.
December’s Diminishing Role in Donor Acquisition
December has historically been a crucial month for donor participation, but its relative impact has steadily declined over the past decade. December 2024 saw the lowest percentage of calendar-year donors in at least 10 years, and likely the lowest in history. The data reveals a steady decline in both the total number and percentage of donors making their first calendar-year gift during the final month of the year.
The first chart below shows the total number of December donors decreasing over time, while the second chart illustrates that December’s share of the year’s total donor count has dropped to around 12%. While the pandemic temporarily disrupted these patterns, the overall trend suggests December is playing a smaller role in annual donor acquisition.
This shift raises important considerations for fundraising teams. Are donors becoming less motivated by year-end giving, moving their giving to an earlier time of the year? Or, are they simply churning altogether? The broader decline in annual donor counts suggests the latter, as we’re not seeing a shift in support to earlier months. A greater emphasis on year-round engagement and segmented outreach will be key to reversing this trend.
Major Gift Donors: Strong Engagement in 2024
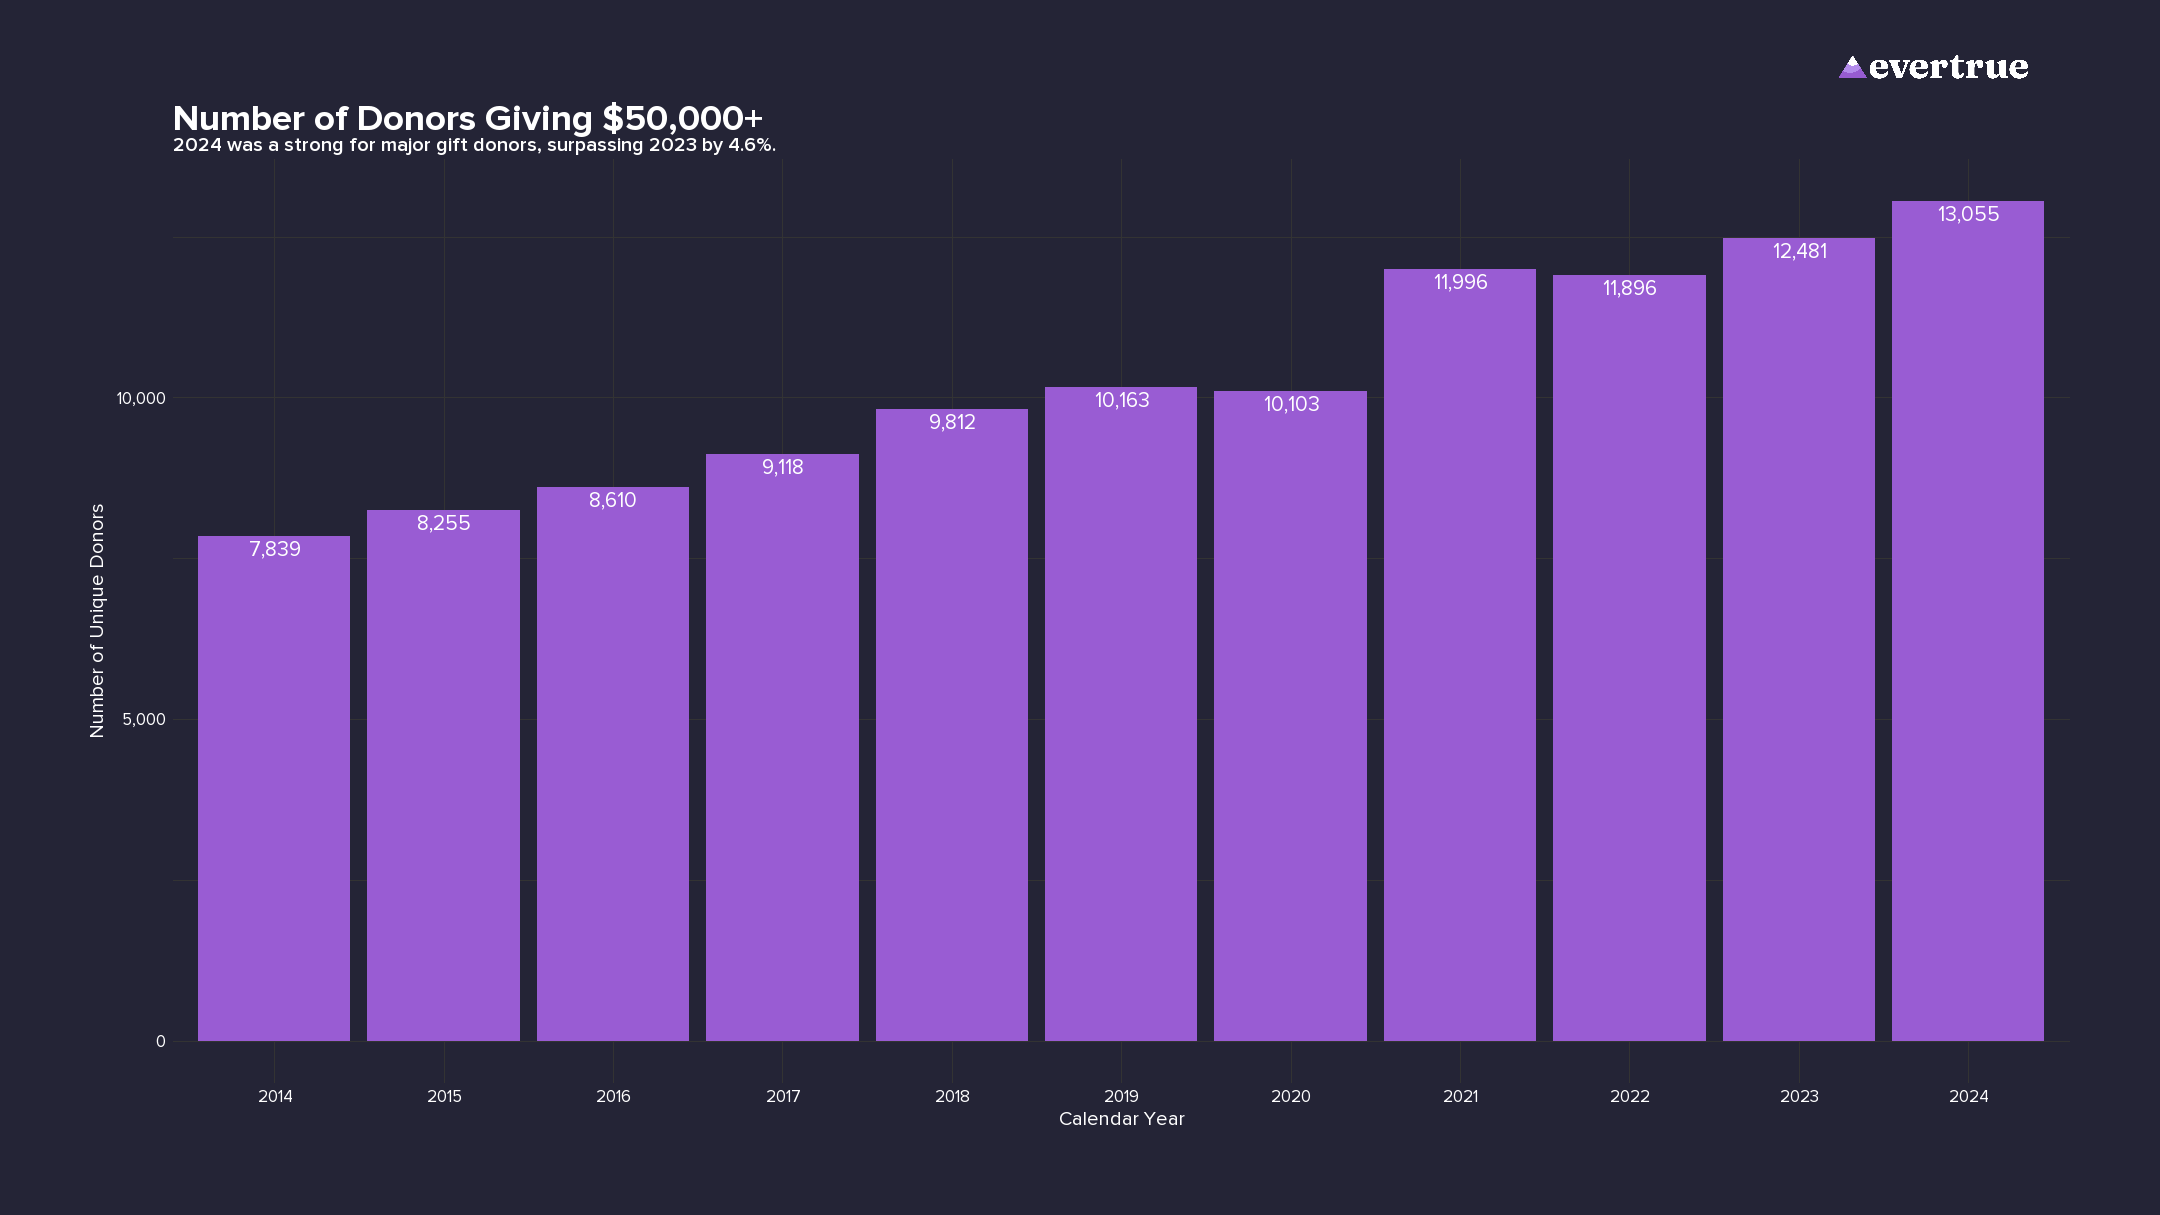
Major gift donor participation reached an all-time high in 2024, reinforcing the importance of high-value contributors to the ongoing success of higher education fundraising programs.
The first chart tracks donors giving $50,000 or more annually.
Major gift donor growth was widespread, with 2 out of every 3 institutions seeing an increase in major gift participation. Additionally, about 1 in every 3 institutions outpaced the industry average for major gift donor growth.
However, institutions must be cautious about over-reliance on a shrinking pool of major donors. Without consistent pipeline development and mid-level donor cultivation, long-term sustainability is at risk.
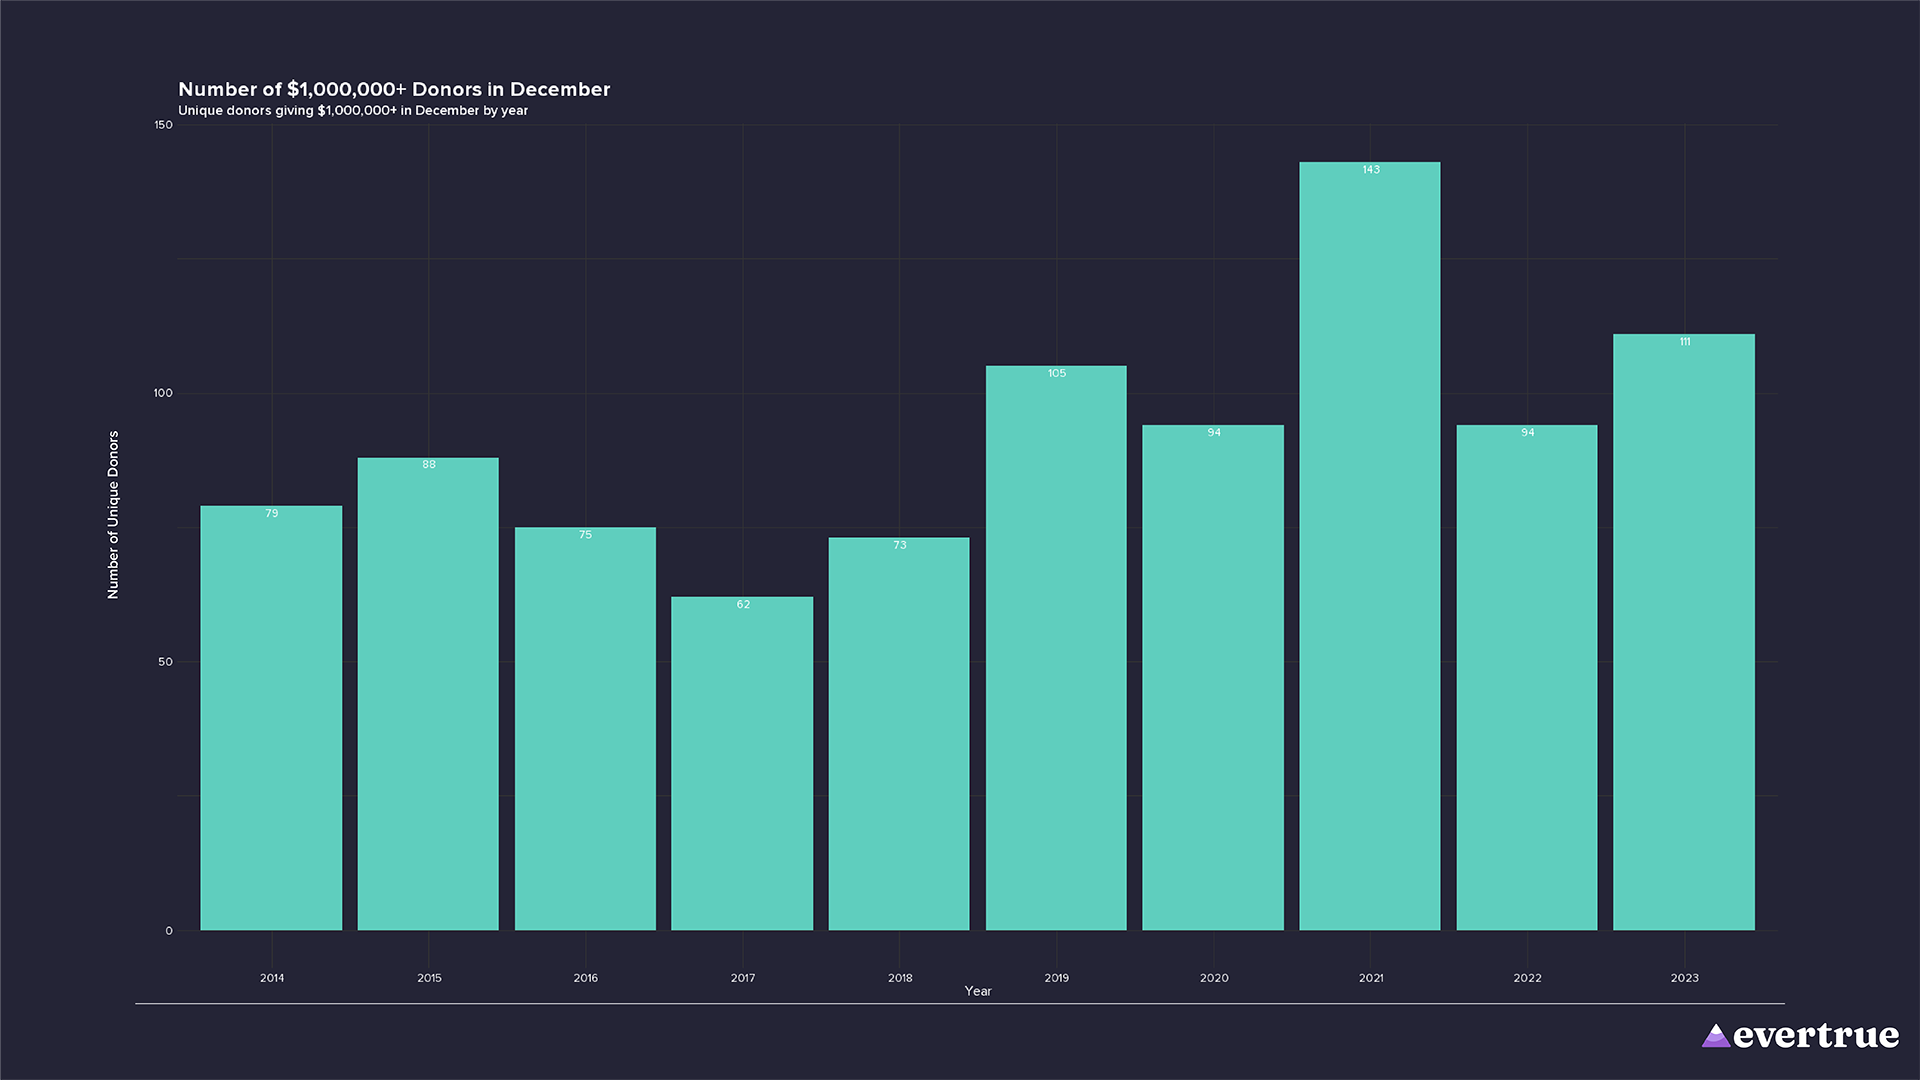
The second chart below highlights a subset of major gift donors contributing $1 million or more, where 2024 has already outpaced 2023’s full-year total. This growth underscores the increasing importance of identifying larger donors within the donor base and helping them become a part of your institutional community.
Year-Over-Year Growth in Major Gift Donors
The chart below highlights year-over-year percentage changes in the number of donors giving $50,000 or more since 2014, providing a clear view of the trends shaping major gift donor engagement. With the exception of the 2020 pandemic outlier, the number of major gift donors has shown consistent growth across this sample of 111 higher education institutions.
Historically, December and June were the dominant months for major gift activity, coinciding with calendar-year and fiscal-year deadlines. However, 2024 data suggests donors are becoming less responsive to these traditional giving cycles.
While some major donors may now be spreading their giving across different months, the overall trend raises concerns about urgency-based solicitations. If fewer donors are responding to time-sensitive appeals, institutions must shift toward relationship-driven engagement that motivates gifts based on mission impact rather than deadlines alone.
Major Gift Donors in December: Key Benchmarks for 2024 Projections
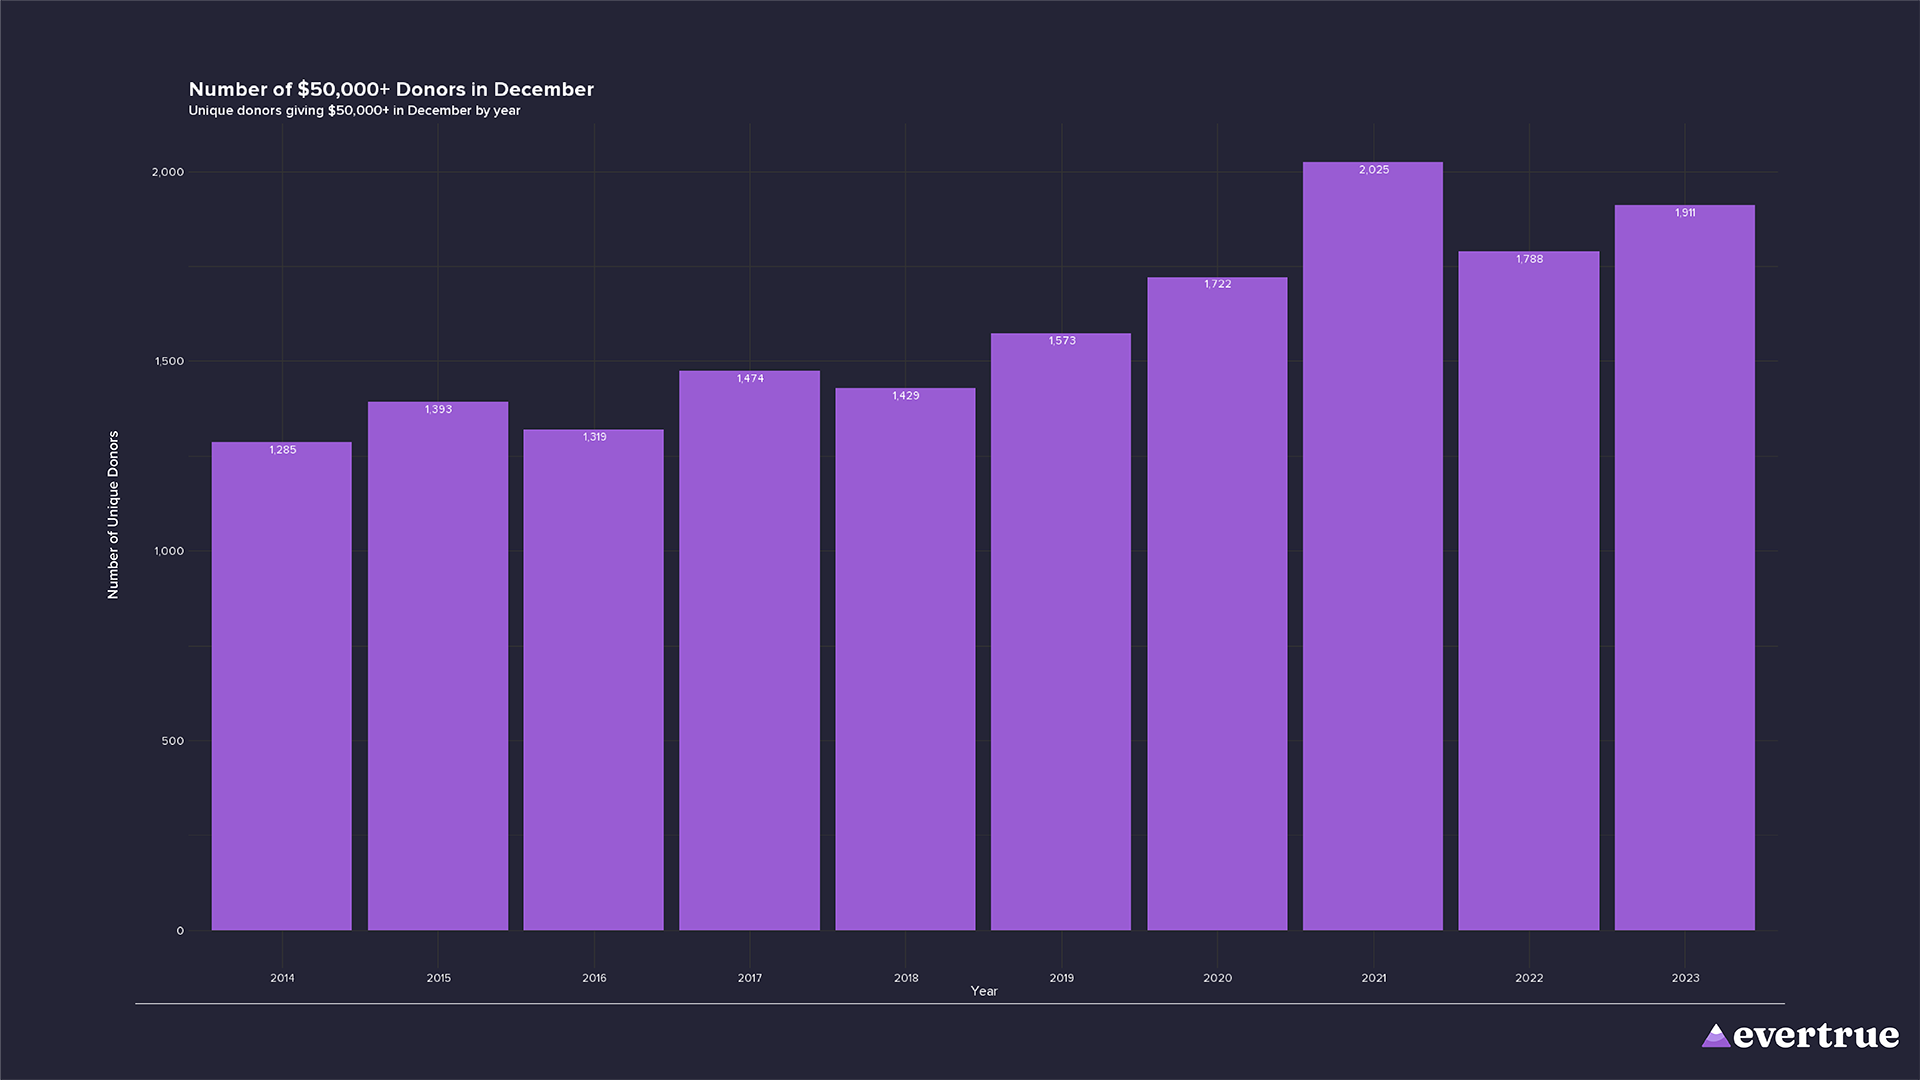
December is an important month for major gift donors, as historically a significant portion of these high-value contributions occur during this period. By analyzing trends in December giving, institutions can shape realistic expectations and plan effectively for year-end results.
This first chart shows the annual count of donors giving $50,000 or more in December. On average, about 15% of these donors make their contributions in December, as reflected in the percentage chart. Institutions can use this data to project the year-end total for major gift donor counts.
Major gift revenue reached an all-time high in 2024, reinforcing the critical role of high-level donors in institutional fundraising.
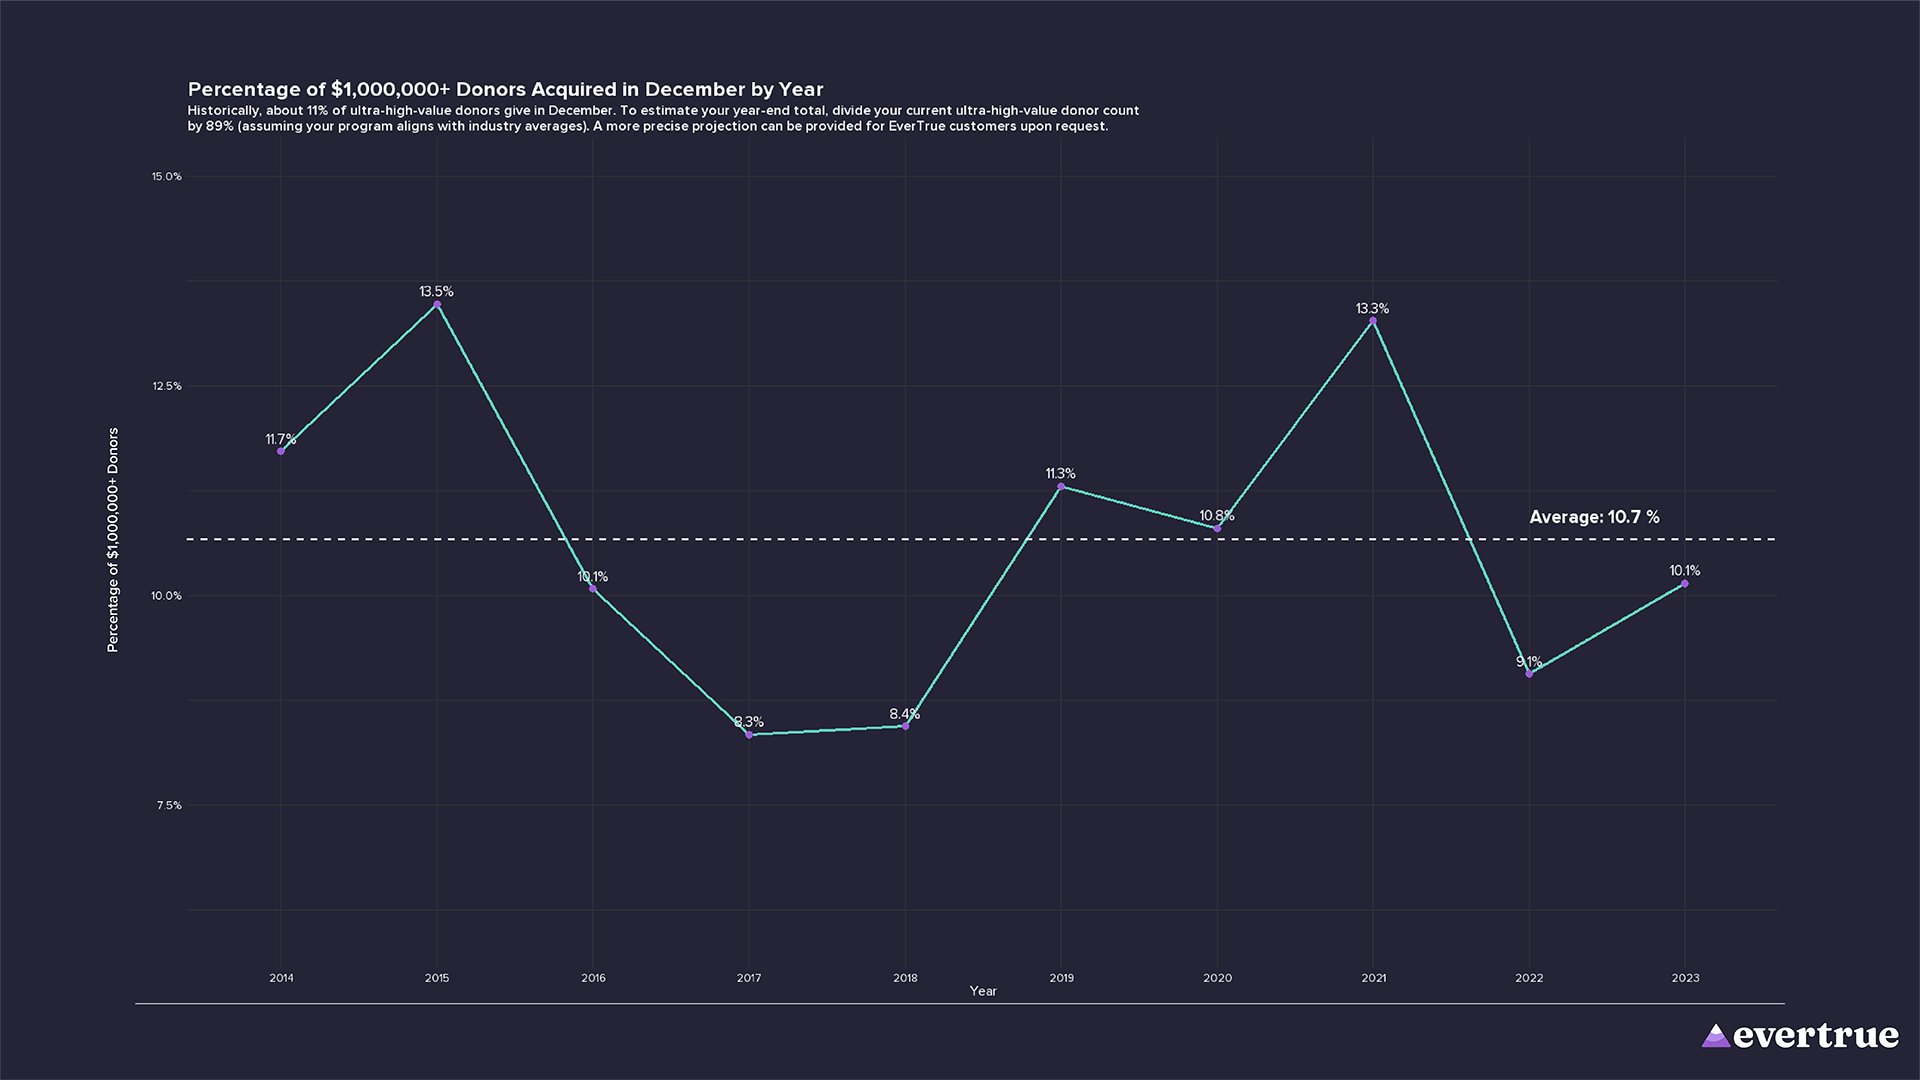
The next charts highlight the number of donors giving $1,000,000+ in December over the years. Historically, about 11% of high-value major gift donors give in December, as shown in the second line chart. This percentage has remained relatively stable, with a slight fluctuation over the years.
Major Gift Revenue: A Strong Year for Fundraising
The total revenue from major gifts (gifts and pledges of $50,000 or more) reached an all-time high in 2024, reinforcing the critical role of high-level donors in institutional fundraising. This trend aligns with what we observed in the major gift donor count section, reaffirming the strong performance of high-value contributions this year.
The first chart highlights the total dollar value of $50,000+ gifts by year, showcasing steady growth in 2024.
The following charts provide a monthly breakdown, revealing that 2024 got off to a remarkable start with one of the most productive Januarys in recent history. Each subsequent month has also performed strongly, maintaining momentum throughout the year.
$1 Million Major Gift Revenue: Exceptional Growth in 2024
Fundraising revenue from donors giving $1,000,000 or more has shown remarkable strength in 2024, outpacing last year’s total even before factoring in December.
The first perspective below demonstrates steady growth in the total dollar value of $1,000,000+ gifts over the years, with 2024 already surpassing 2023’s full-year total.
This extraordinary performance is bolstered by an exceptionally productive January, which set the tone for a strong year overall, as seen in the second chart.
Major Gift Revenue Growth by Institution: A Look at 2024 Trends
This view below highlights the year-over-year percentage change in major gift revenue ($50,000+ gifts) across the institutions in our sample, comparing January through December 2024 to the same period in 2023.
While the average increase in major gift revenue was 65%, this growth was not evenly distributed. Some institutions benefited from one-time transformational gifts, while others saw incremental growth driven by consistent donor engagement.
What’s particularly important about this growth is that it’s not being driven by a small number of institutions performing exceptionally well. Instead, the data demonstrates a diversified growth pattern across institutions of all shapes and sizes, reflecting a broad and inclusive trend in major gift fundraising.
However, these record-breaking totals should be viewed with caution:
A single transformational gift can skew year-over-year growth, making some gains difficult to replicate.
Goal-setting should focus on pipeline health rather than annual revenue totals to ensure long-term sustainability.
A strong mid-level giving program is essential for cultivating future major donors and ensuring steady growth.
Without a strategic approach to pipeline development, institutions risk an over-reliance on a small number of large gifts, creating volatility in fundraising results.
To maintain momentum, institutions must:
Expand mid-level giving strategies to build a reliable pipeline.
Strengthen donor engagement efforts through personalized outreach.
Leverage data-driven approaches to identify and cultivate emerging major donors.
While this growth is encouraging for institutions benefiting from increased resources to support their missions, it is important to view these trends as reflective of 2024’s unique conditions rather than a guarantee of continued growth in future years.